- 6892
- 452
- 12
- 13
- 0
- Help Ukraine
About the solution
John Gardner, a physicist at Oregon State University (OSU) in Corvallis, was blind in one eye but he became completely blind after having surgery to remove the pressure of his good eye. John’s job involved interpreting graphs precisely, “Getting it exactly right all the time was incredibly important,” John explained. However, when he became blind in 1988, he had to approach his job differently.
For a while, John was helped by his supervised students. Then, in 1996, a team at OSU created by John, financed by the National Science Foundation (NSF) invented braille to read graphs and data.
Braille consists of raised dots that take the place of printed letters. John’s team applied the braille concept to math and visual data. They created a printer squeezes paper between pointy tools called punches and little cups, called dies. When the punches press into the dies, they make raised dots on the paper between them. The type of printing with raised dots is called embossing.
In 2000, John decided to work full time to develop this assistive technology, because no one would commercialise or licensing the product. Therefore, he and his wife set up ViewPlus Technologies.
John focused on developing new printers able to work with common software programs such as Word and Excel. The new printers had a higher embossing capacity to allow printing more detailed graph or chart. Moreover, using dots with different heights allowed to include contrasting, which is usually done by the use of different colours.
John’s team developed also interactive ‘talking’ pictures. A system that combines a tactile printout with a computer to make interactive charts and graphs. A touchscreen linked with a computer, where the corresponding file is open, reads aloud when someone touches the printout on the touchscreen. This system allows sighted and low-vision users to work on the same document.
“Early versions of the embosser did need a sighted person to prep the text that goes along with a graph”, John said. “The latest printers let blind people tinker with text. They also can resize images and change how a graph’s shaded areas are filled in with dots. They even can print braille and audio-touch graphics by themselves.”
Adapted from: https://www.sciencenewsforstudents.org/article/printer-makes-visual-aids...
https://abilitymagazine.com/Gardner-viewplus.html
More information: https://viewplus.com/
This solution shall not include mention to the use of drugs, chemicals or biologicals (including food); invasive devices; offensive, commercial or inherently dangerous content. This solution was not medically validated. Proceed with caution! If you have any doubts, please consult with a health professional.
DISCLAIMER: This story was written by someone who is not the author of the solution, therefore please be advised that, although it was written with the utmost respect for the innovation and the innovator, there can be some incorrect statements. If you find any errors please contact the patient Innovation team via info@patient-innovation.com
-
-
566
-
0
-
7781
Graduates team creates an app to help visually impaired in their education
Studying
Reading
COMMUNICATION: Communicating, whether by speaking, listening, or other means
Blindness
Assistive Daily Life Device (to help ADL)
App (Including when connected with wearable)
Online service
Vision problems
Promoting self-management
Promoting inclusivity and social integration
Improving Speech and Communication
To improve Treatment/Therapy
Raise awareness
Ophthalmology
India
-
-
-
638
-
0
-
8737

Woman invents a tablet for blind people
-
-
-
426
-
0
-
4694
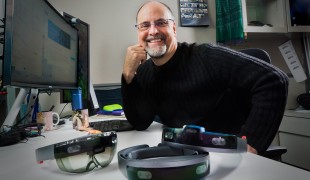
Using AI to allow blind people to find familiar faces
COMMUNICATION: Communicating, whether by speaking, listening, or other means
Social interaction
Blindness
5 Senses support devices: (glasses, hearing aids, headphones...)
Body-Worn solutions (Clothing, accessories, shoes, sensors...)
App (Including when connected with wearable)
AI algorithm
Assistive Daily Life Device (to help ADL)
Difficulty communicating with environment
Confusion
Regaining sensory function
Promoting self-management
Promoting inclusivity and social integration
Improving Speech and Communication
Raise awareness
Ophthalmology
Pediatrics
United States
-